Time series of daily satellite CHL concentration values for a period before the chosen day, and 9 days of forecast issued on the chosen day (centred at mid-day). Values are domain averages for the selected sub-area.

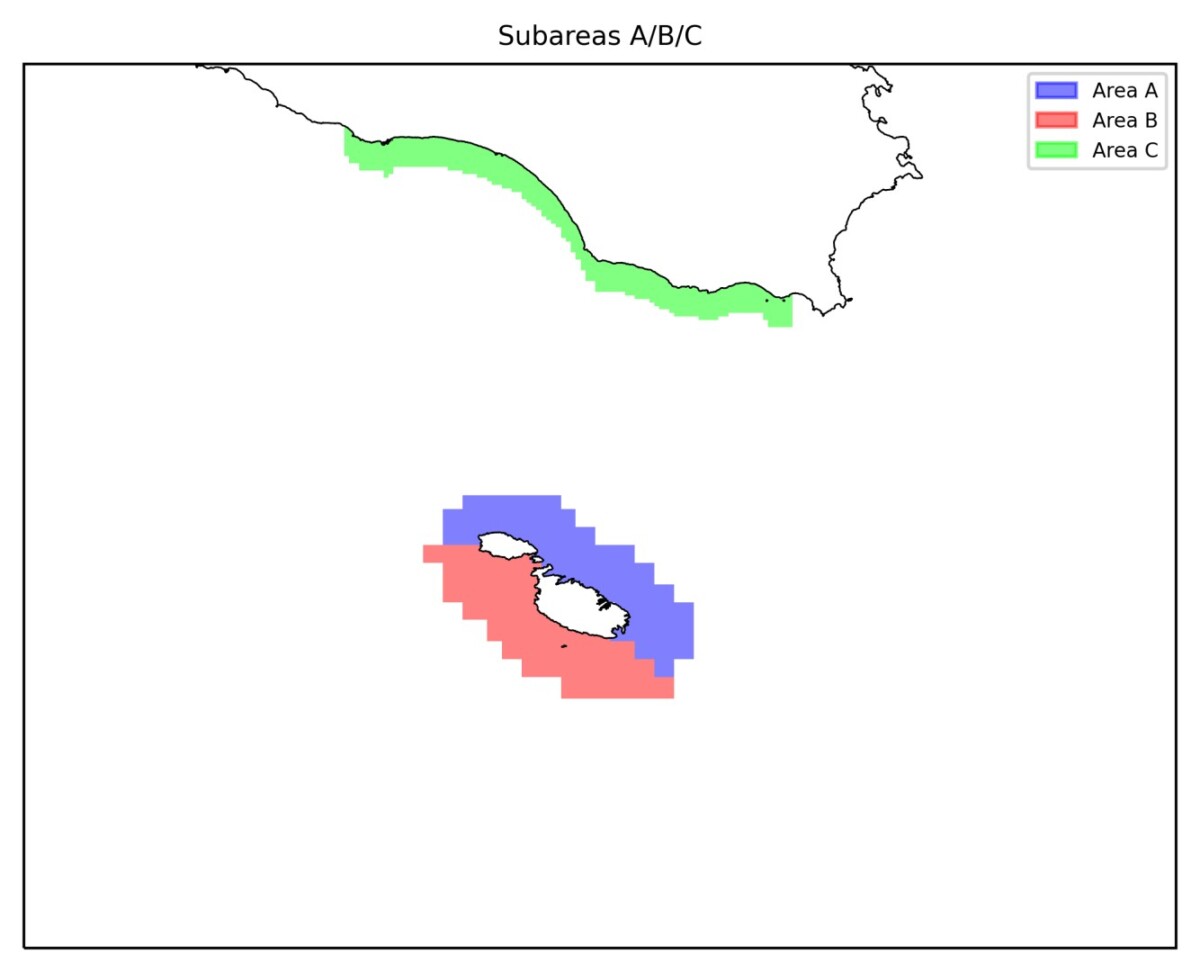
Select subarea for viewing synopsis and statistics
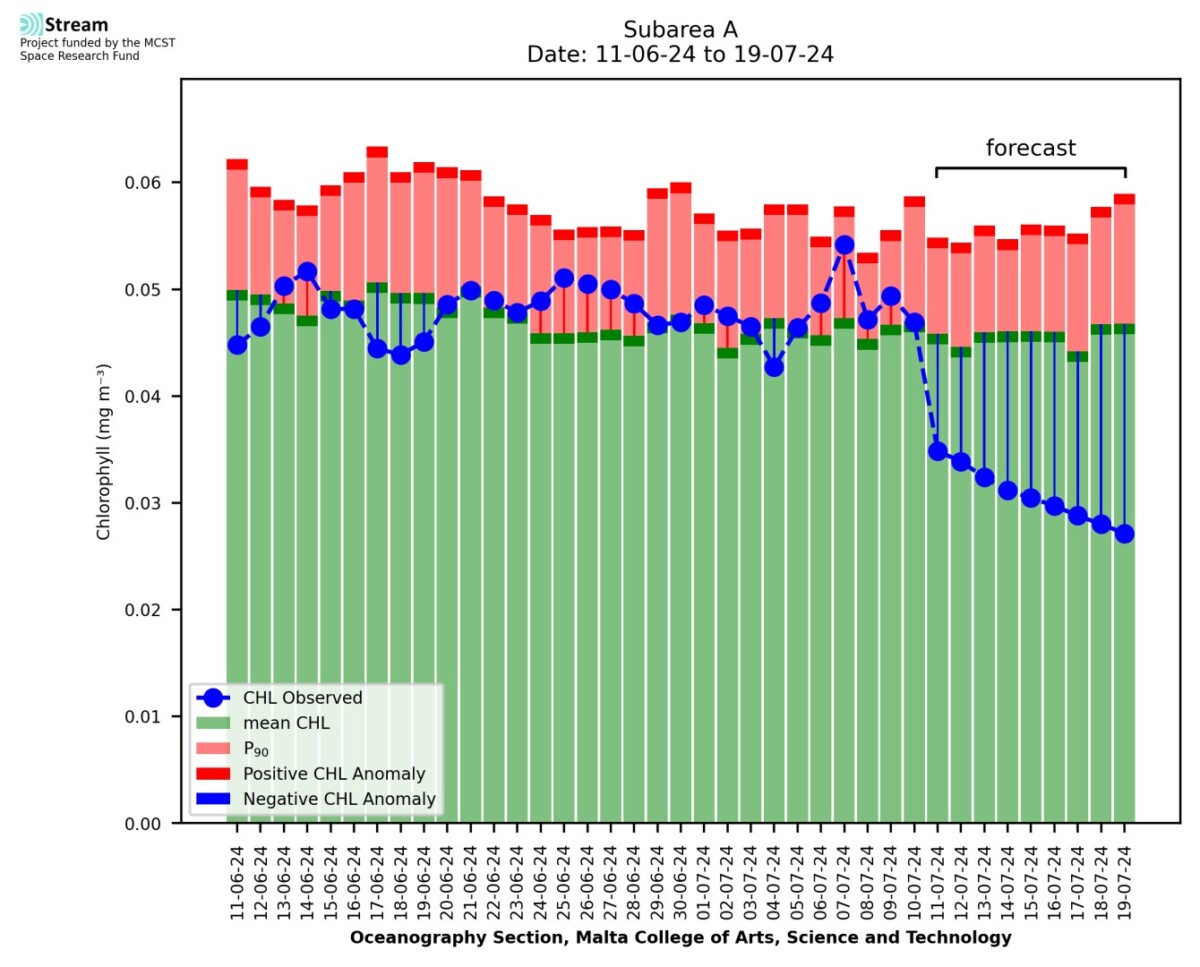
Mean CHL Area A
0.05
Min CHL Area A
0.03
Max CHL Area A
0.15
Standard Dev CHL Area A
0.01
Mean CHL Climatology
Area A
Area A
0.05
90th percentile Area A
0.06
Mean CHL Anomaly Area A
-0
Domain-averaged CHL statistics (mg/mm3) for the chosen day and sub-area.
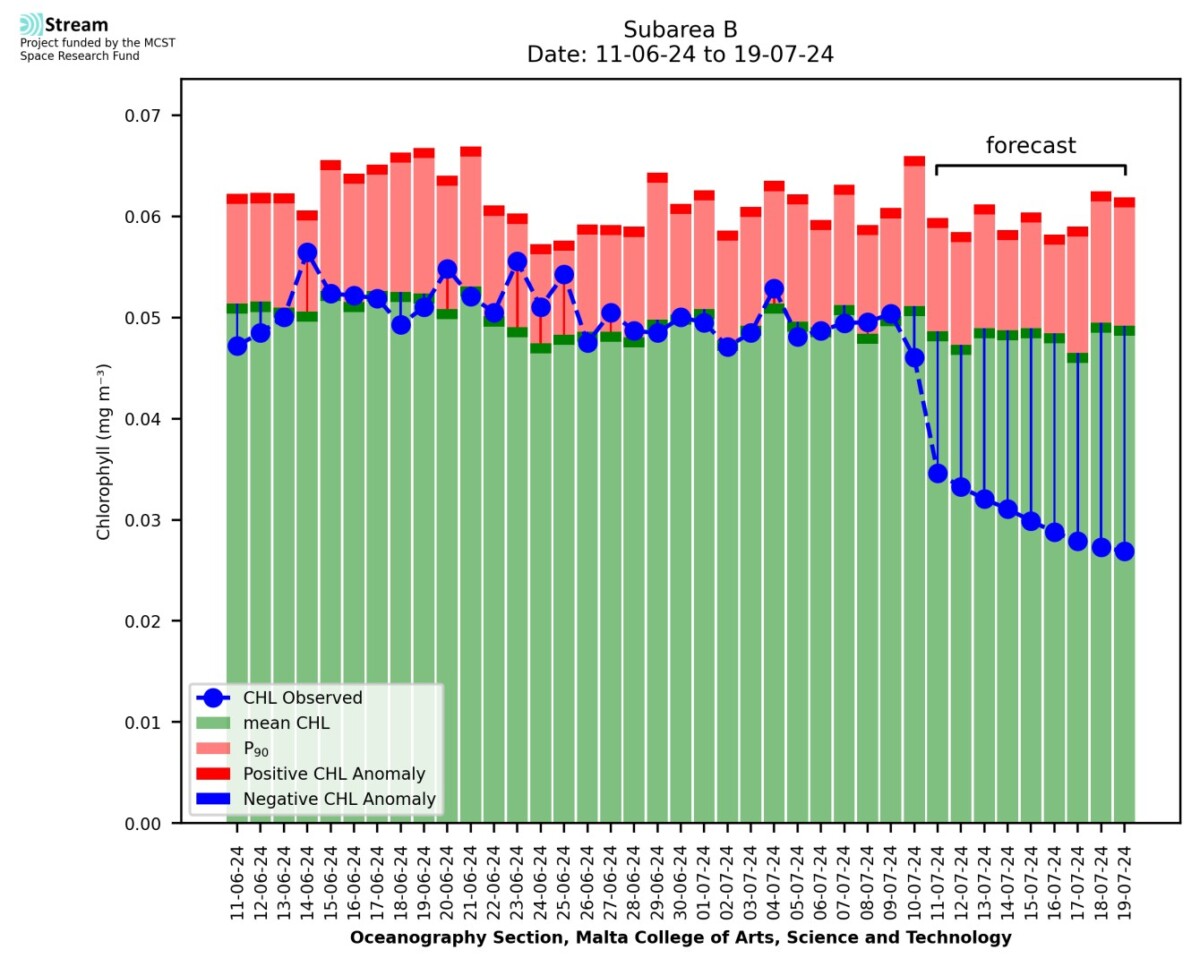
Time series of daily SST values for a period before the chosen day, and 9 days of forecast issued on the chosen day. Values are domain averages for the selected sub-area.
Mean CHL Area B
0.05
Min CHL Area B
0.04
Max CHL Area B
0.11
Standard Dev CHL Area B
0
Mean CHL Climatology
Area B
Area B
0.05
90th percentile Area B
0.07
Mean CHL Anomaly Area B
-0.01
Domain-averaged CHL statistics (mg/mm3) for the chosen day and sub-area.
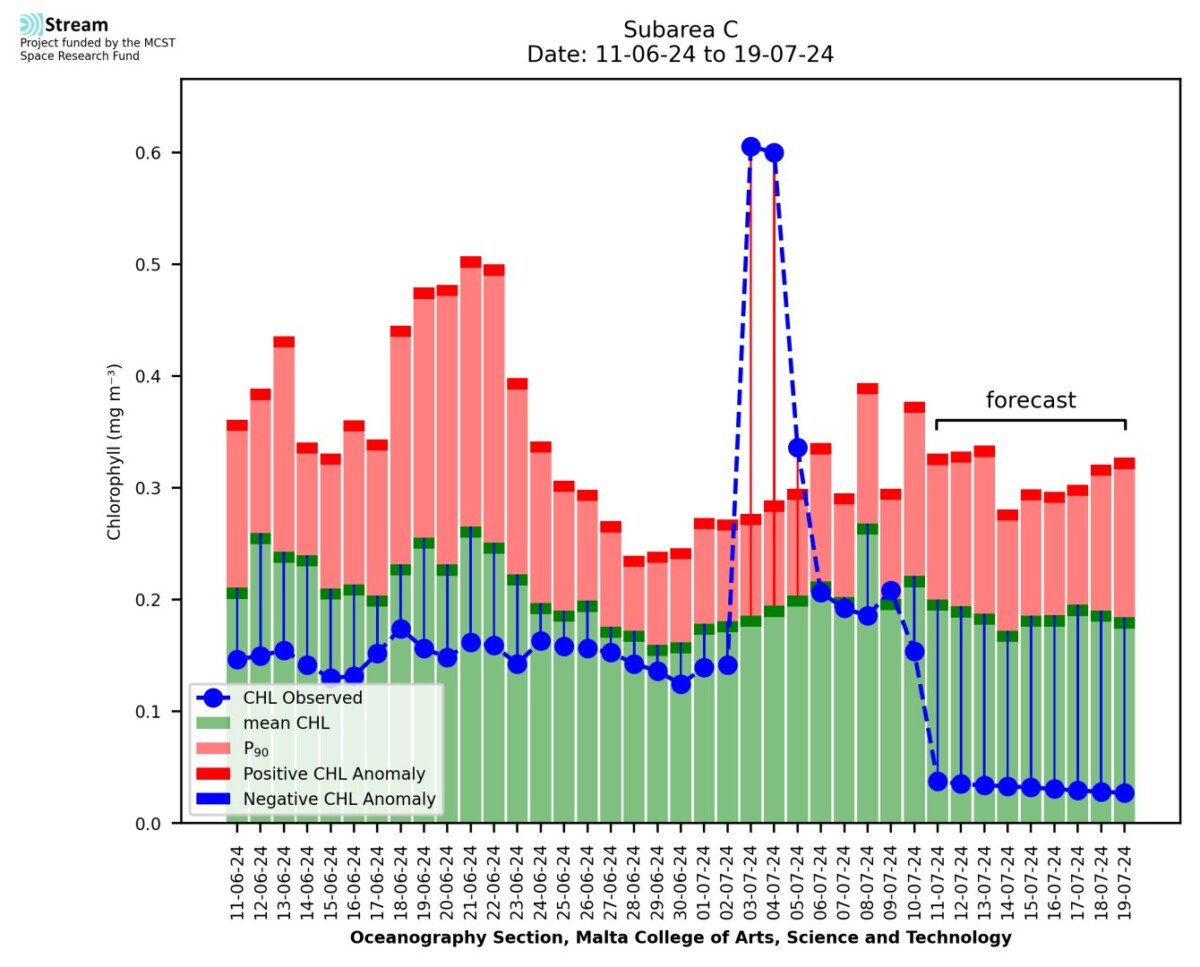
Time series of daily satellite CHL concentration values for a period before the chosen day, and 9 days of forecast issued on the chosen day (centred at mid-day). Values are domain averages for the selected sub-area.
Mean CHL Area C
0.15
Min CHL Area C
0.06
Max CHL Area C
0.69
Standard Dev CHL Area C
0.1
Mean CHL Climatology
Area C
Area C
0.22
90th percentile Area C
0.38
Mean CHL Anomaly Area C
-0.07
Domain-averaged CHL statistics (mg/mm3) for the chosen day and sub-area.
The STREAM project partners make every effort to ensure that information contained in these pages is accurate and up to date. However, the STREAM partners do not accept any liability and/or responsibility for the reliance placed by the users of these pages on the information contained in these pages or any other information accessed via this web page. The information provided in these pages is provided on an “as is” basis, and no warranties of any kind are issued whether expressly or implied by the STREAM partners on the information provided.
The STREAM project partners make every effort to ensure that information contained in these pages is accurate and up to date. However, the STREAM partners do not accept any liability and/or responsibility for the reliance placed by the users of these pages on the information contained in these pages or any other information accessed via this web page. The information provided in these pages is provided on an “as is” basis, and no warranties of any kind are issued whether expressly or implied by the STREAM partners on the information provided.
The STREAM project partners make every effort to ensure that information contained in these pages is accurate and up to date. However, the STREAM partners do not accept any liability and/or responsibility for the reliance placed by the users of these pages on the information contained in these pages or any other information accessed via this web page. The information provided in these pages is provided on an “as is” basis, and no warranties of any kind are issued whether expressly or implied by the STREAM partners on the information provided.